Objectives
The objectives of the current stack are on several fronts:
-
For end users to be able to monitor their compute units in real time. Besides the conventional metrics like CPU usage, memory usage, etc., the stack also exposes metrics like energy consumption and equivalent emissions in real time. The stack is also capable of showing the aggregate usage metrics of a given project/tenant/namespace.
-
For the operators/admins to be able to monitor the usage of the cluster in terms of CPU usage, memory, energy, etc. With this stack, operators will be able to identify the top consumers of the resources in the cluster, users/projects that are under-consuming the allocated resources, etc.
CEEMS has been designed to be modular and extensible, i.e., CEEMS is meant to support multiple clusters at the same time. For instance, imagine a Data Center (DC) has a SLURM cluster and an OpenStack cluster. A single deployment of CEEMS should be able to consolidate the metrics data of SLURM jobs and OpenStack VMs and expose it to end users using a single instance of Grafana.
End user's perspective
The following screenshots show some of the capabilities of CEEMS when used with Grafana.
These are only a few dashboards built to demonstrate the capabilities of CEEMS, and the operators are free to create more dashboards according to their business requirements.
Breakdown of energy usage of different users of a given project during a given period of time
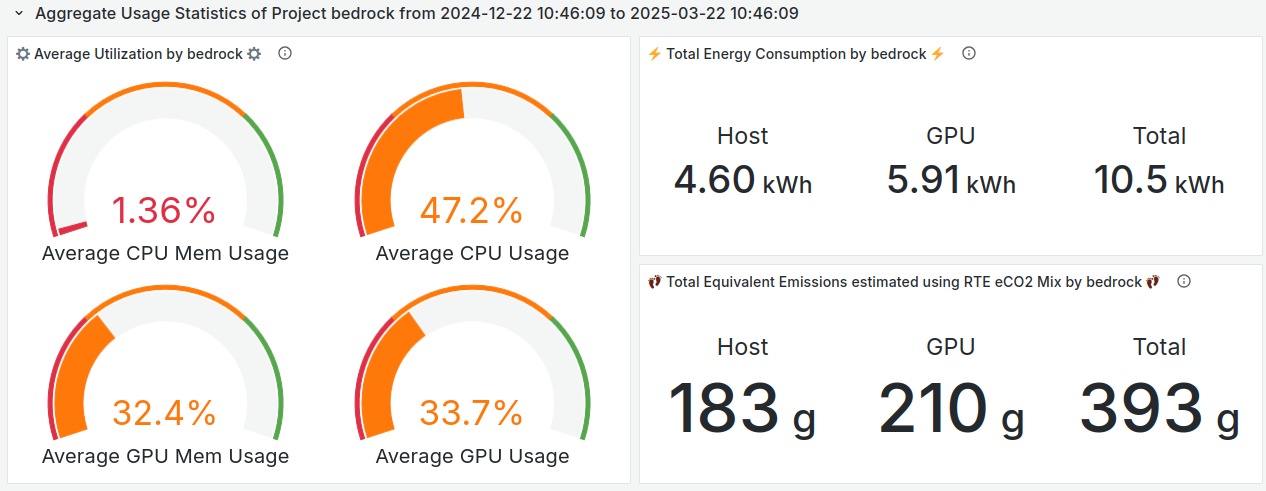
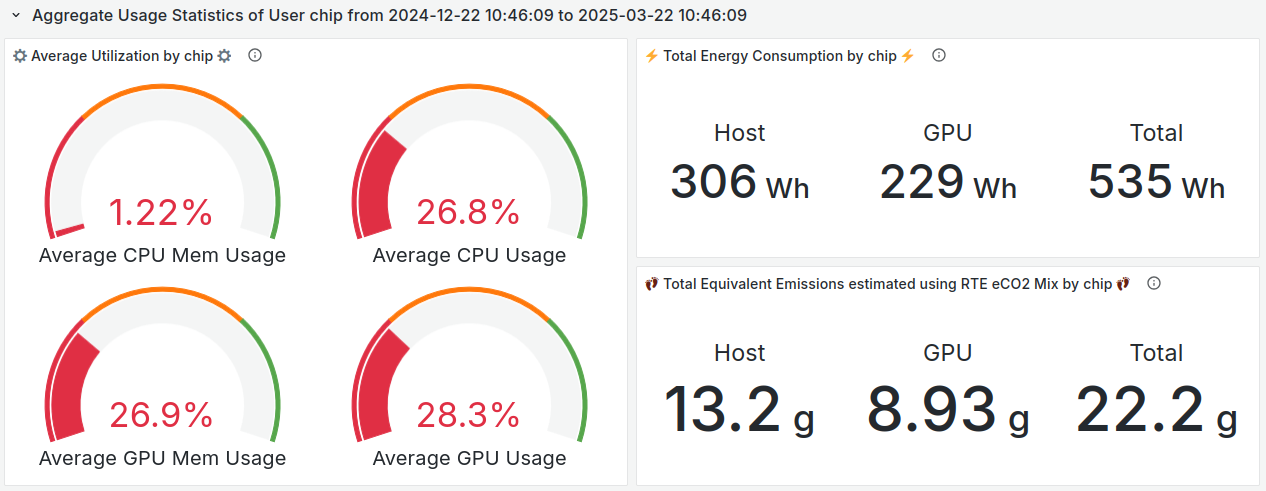
Total resource usage of a given user during a given period of time
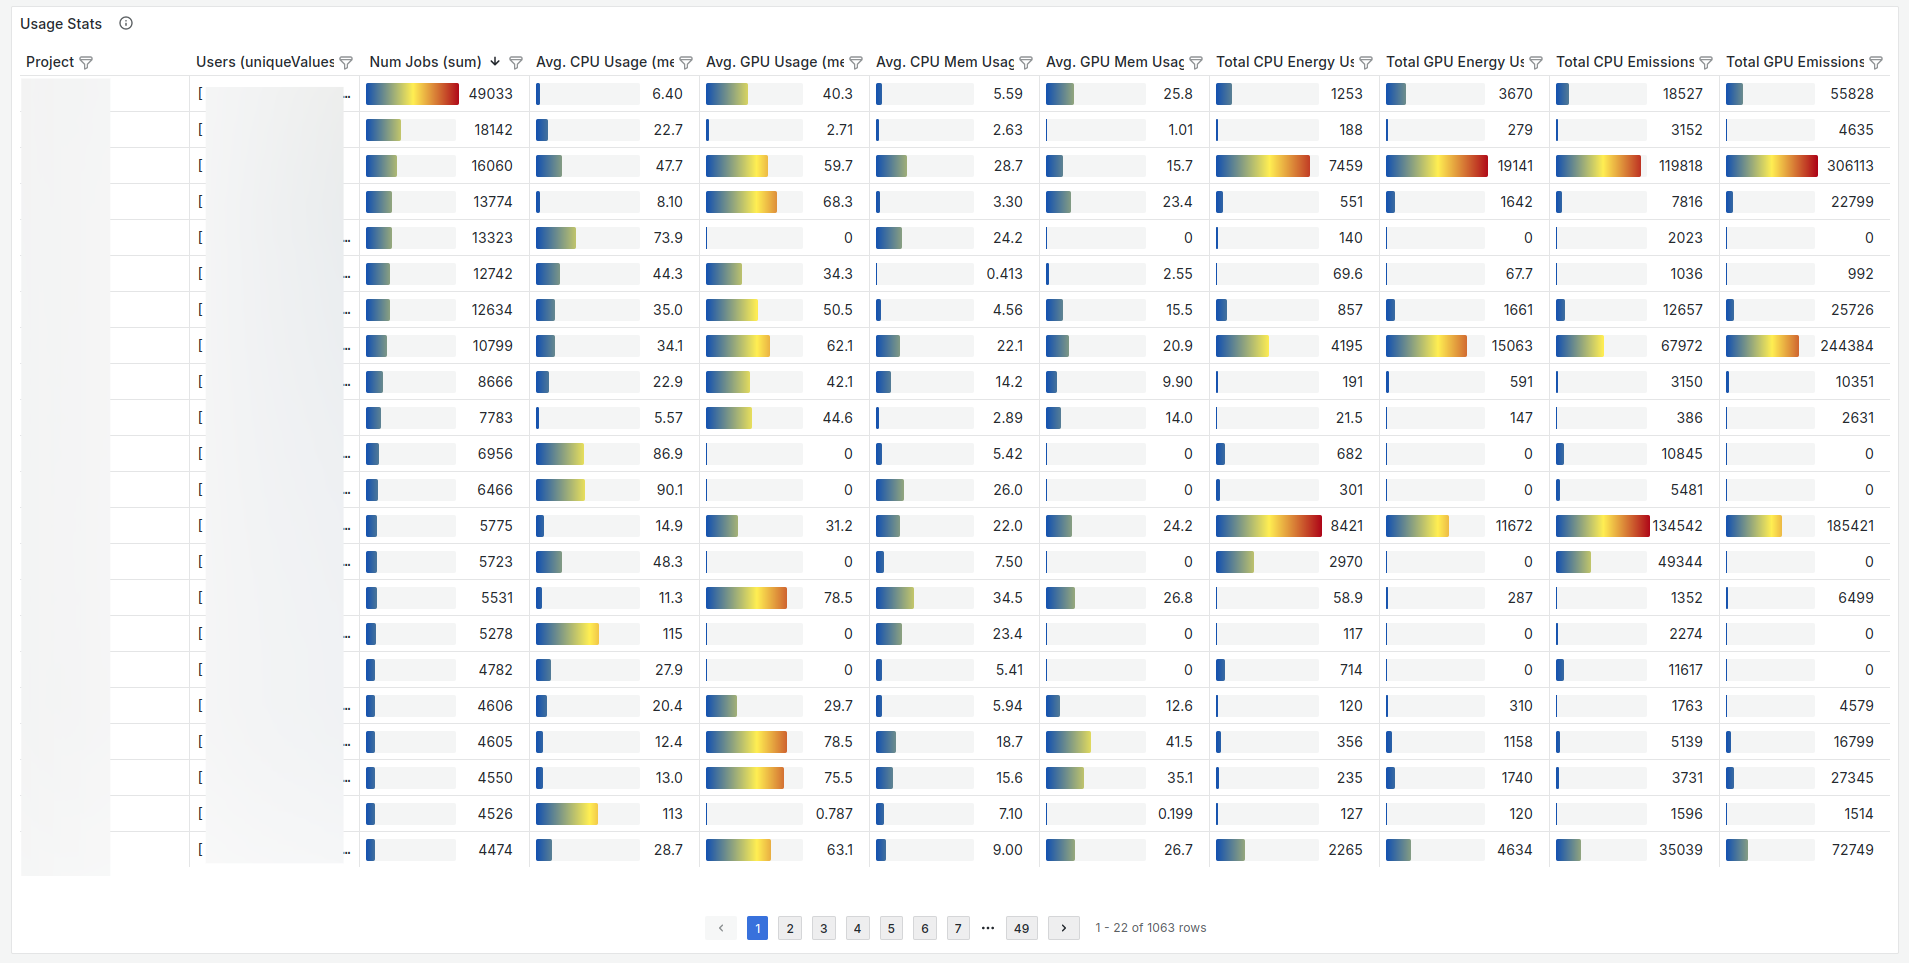
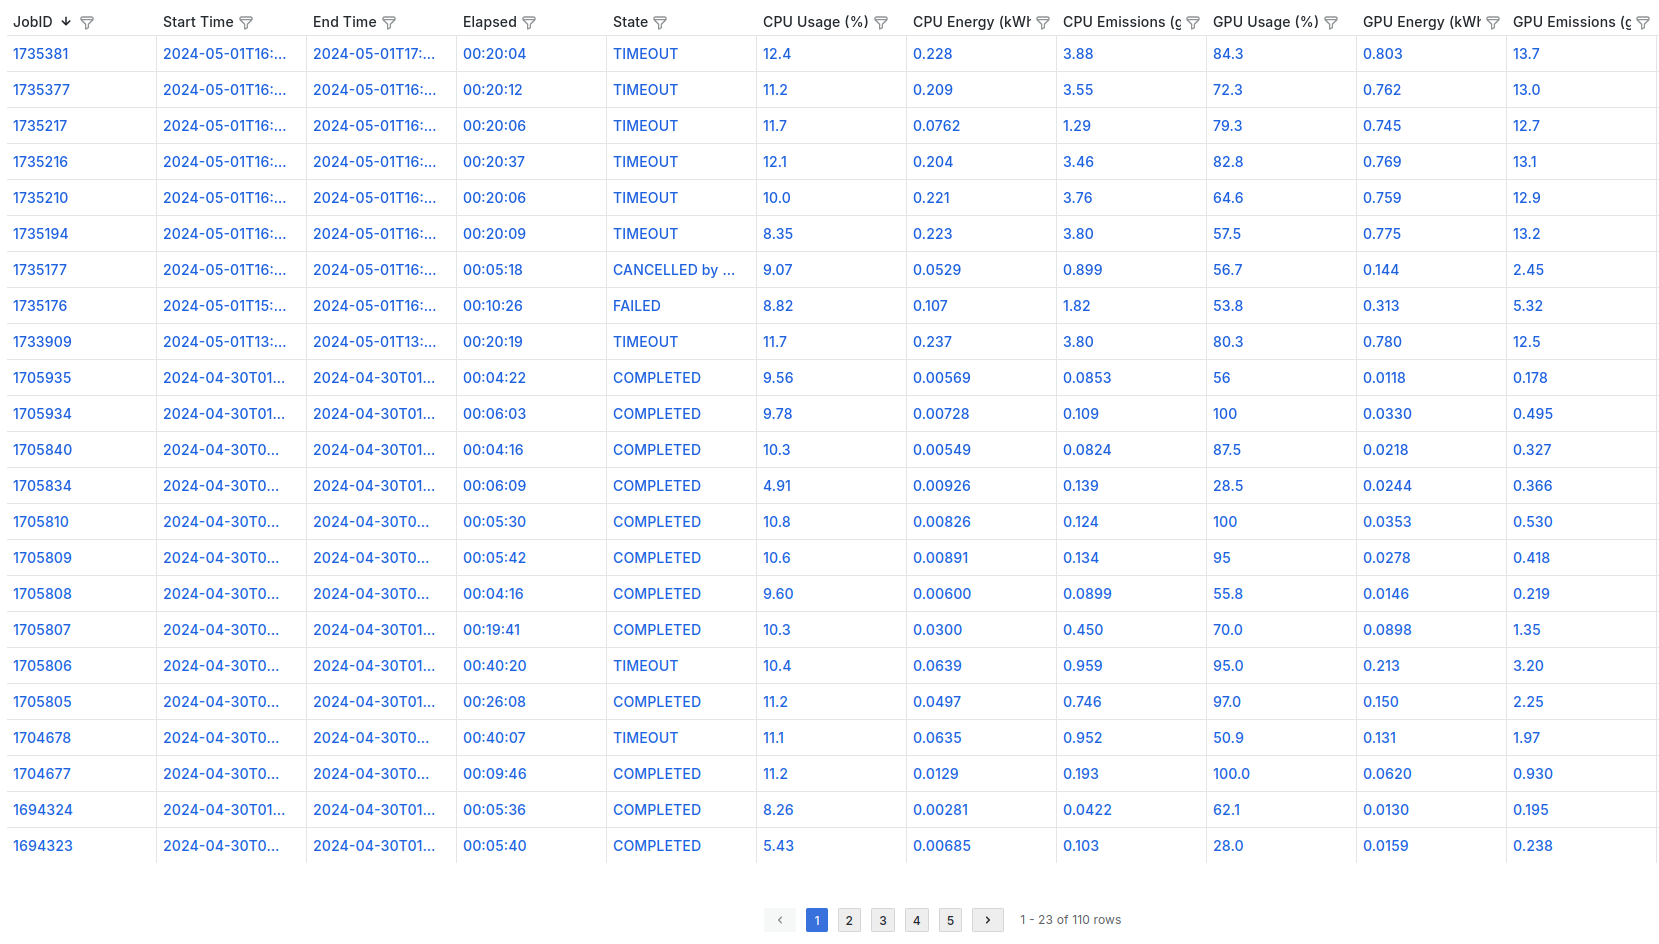
List of compute units with their aggregate usage metrics of a given user during a given period of time
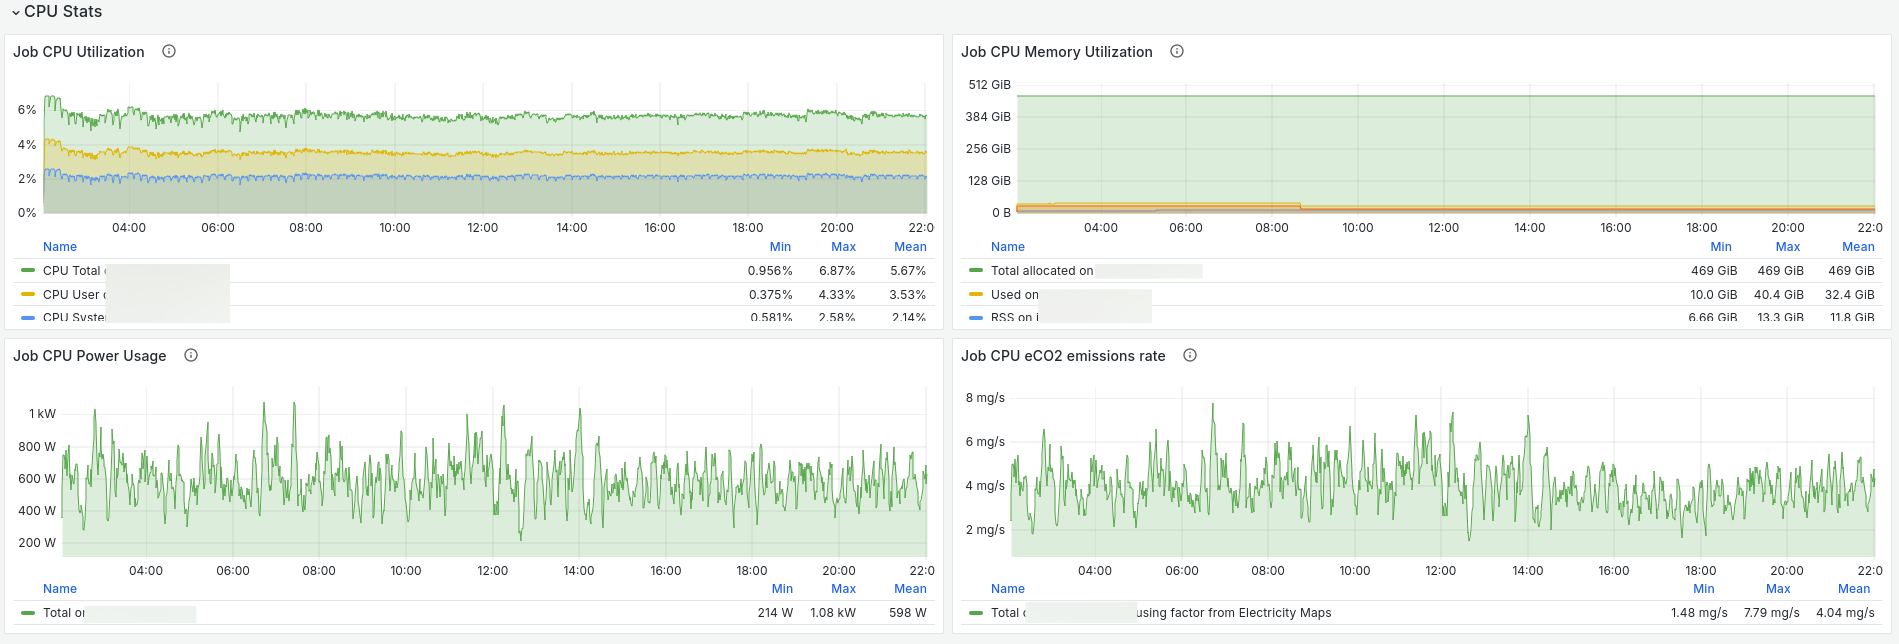
Time series CPU metrics of a given compute unit
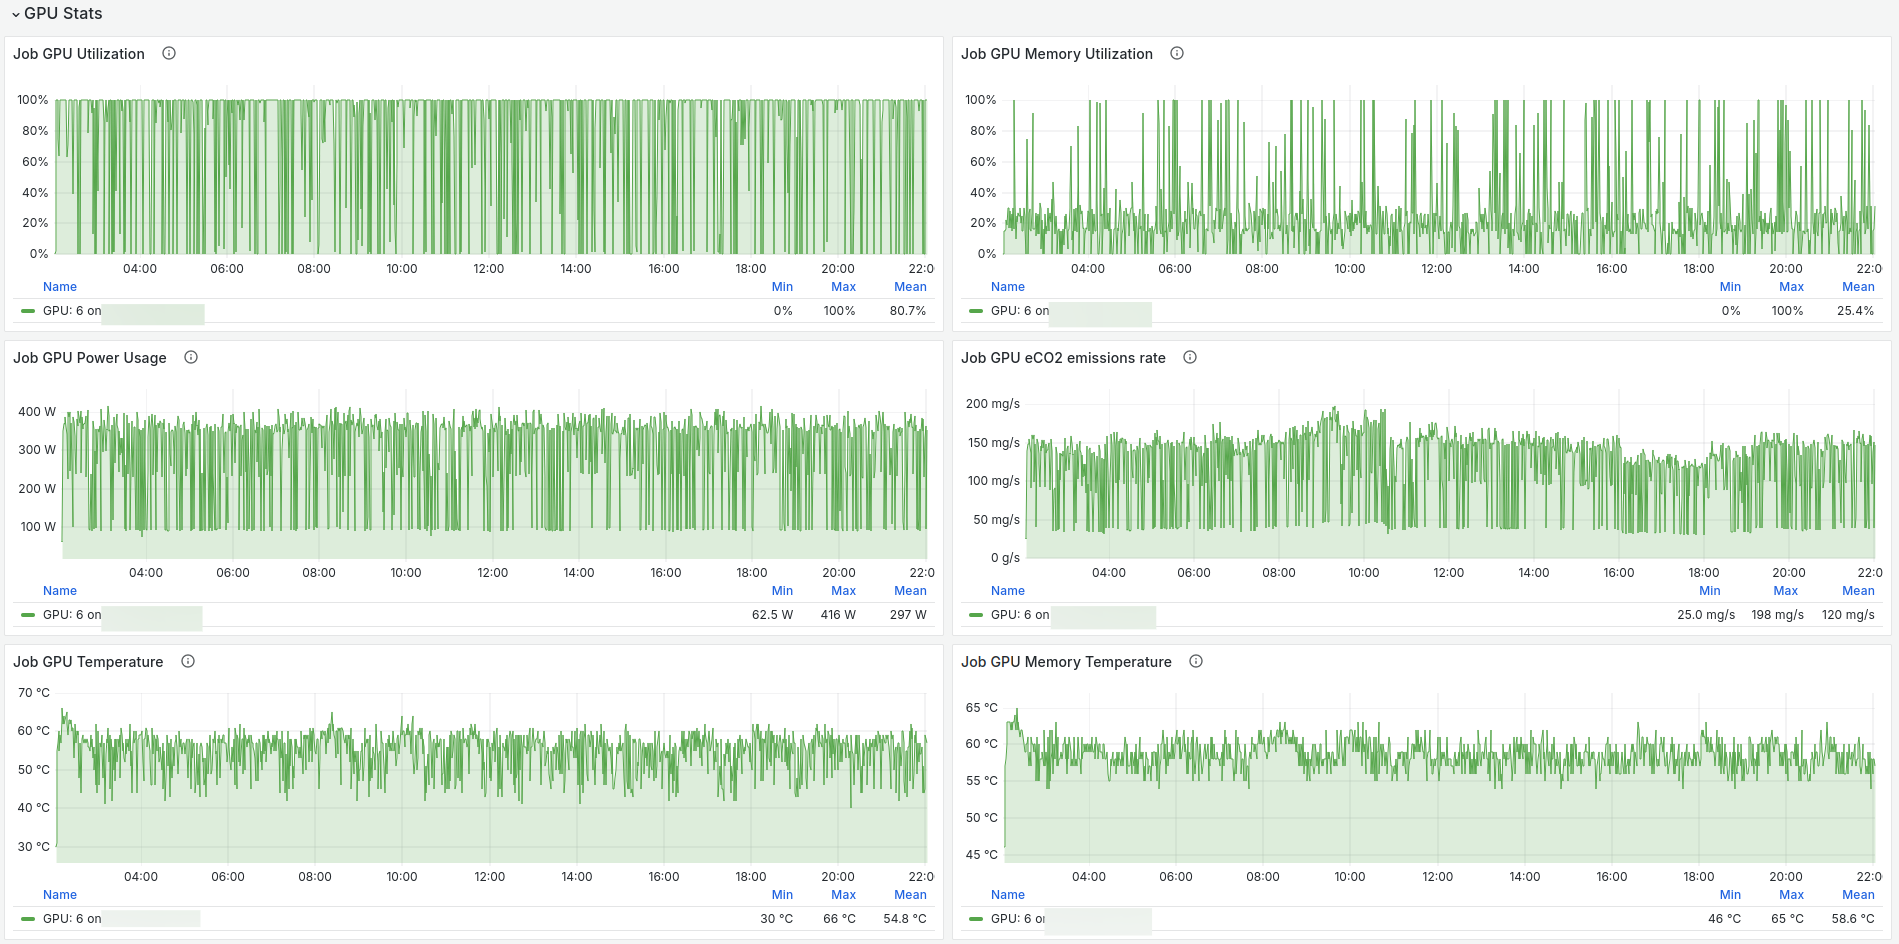
Time series GPU metrics of a given compute unit
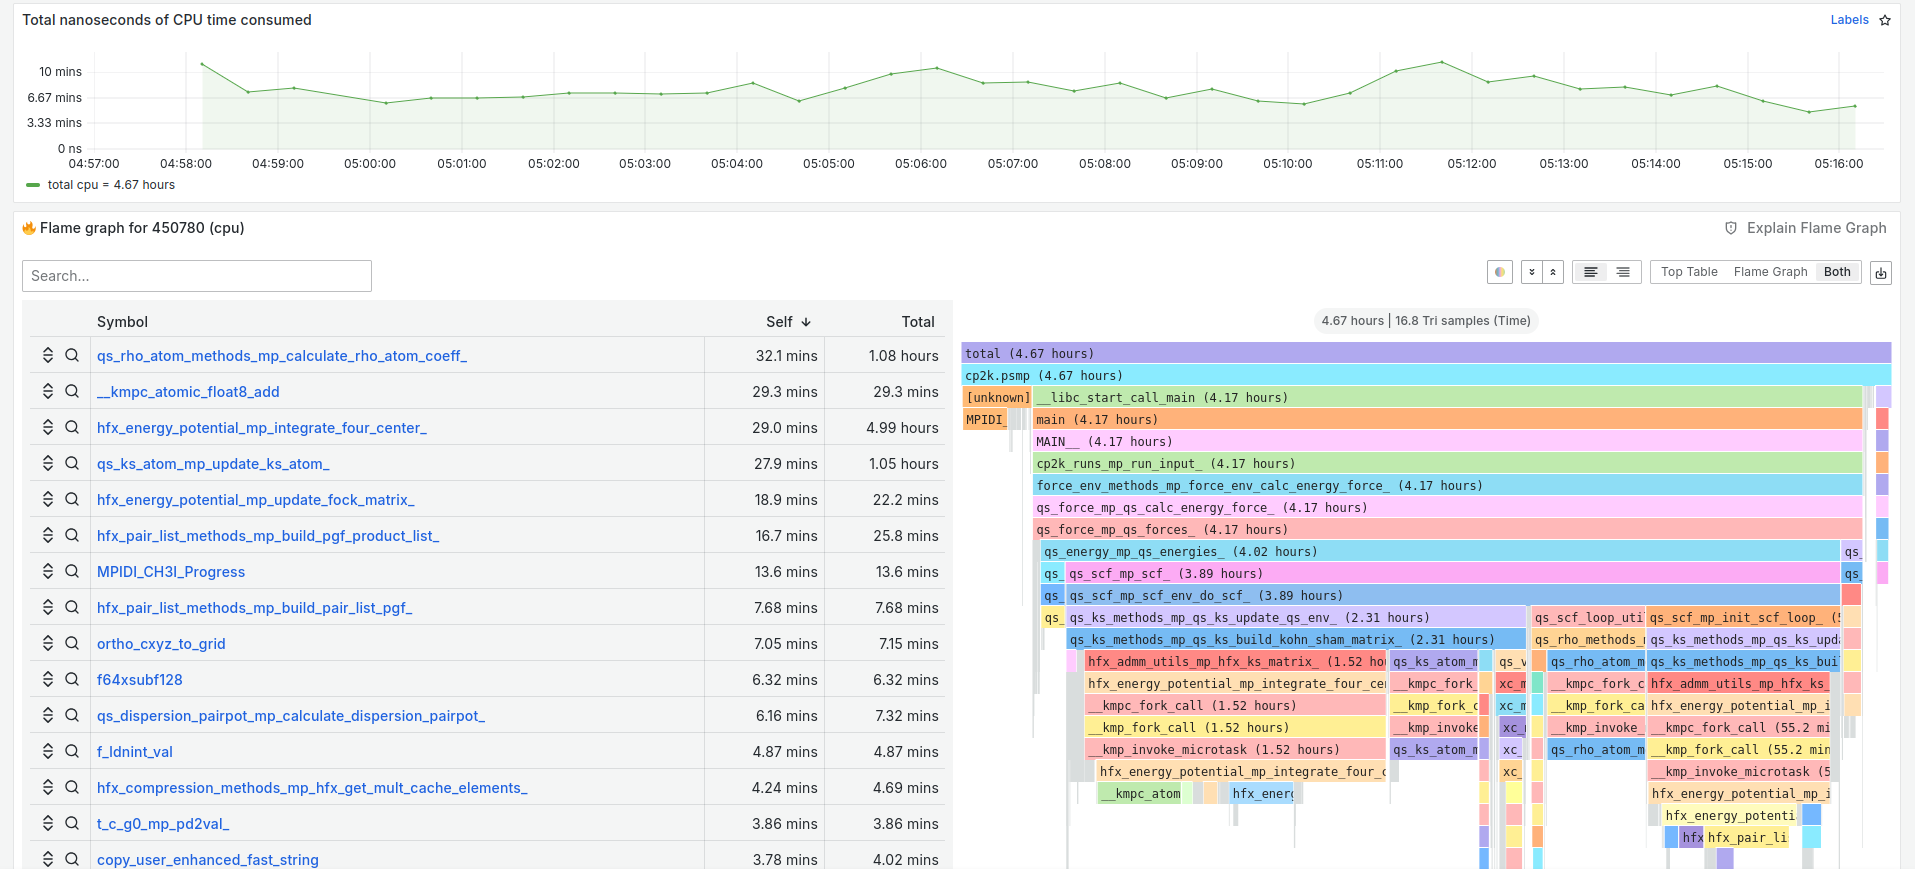
Continuous profiling of a given compute unit
Admin's/Operator's perspective
Resource usage of entire cluster with time
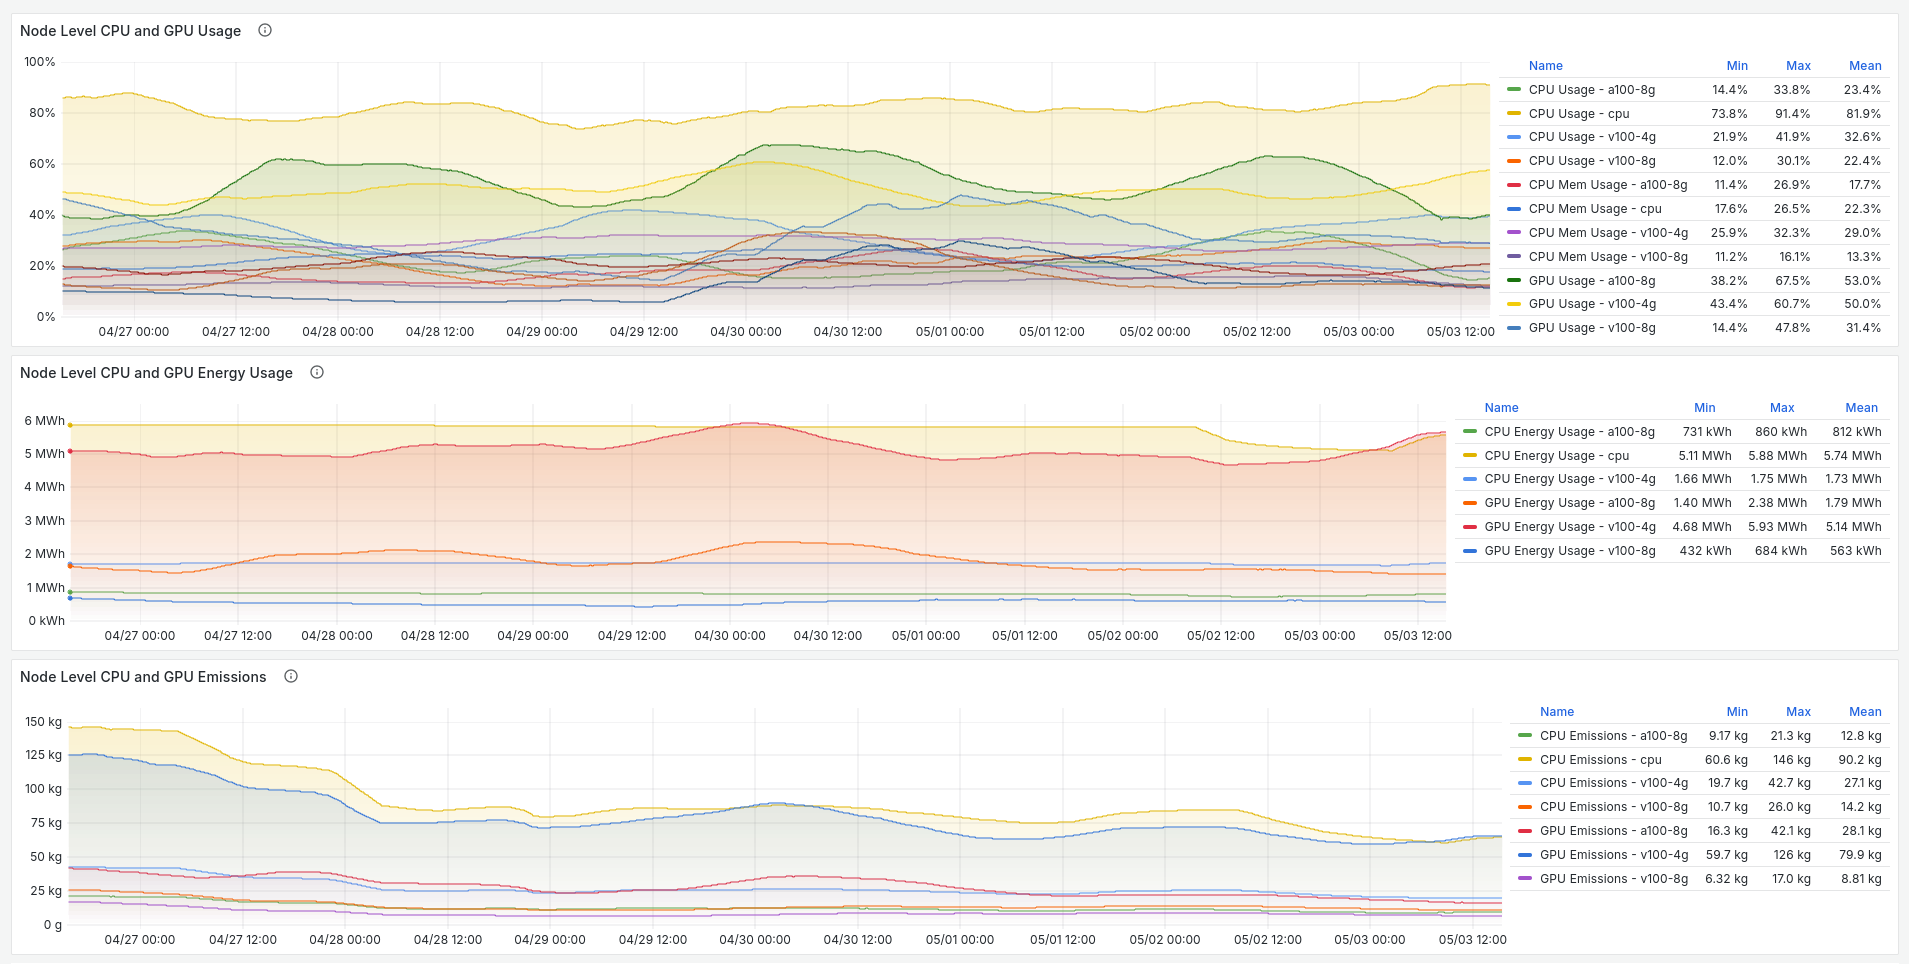
This is an interesting metric as we can clearly see there is a considerable reduction in the emissions even when the overall energy consumption remained the same. This is due to the fact that we use real-time emission factors which can be dynamic, and a small change in factor can have huge implications in emissions for big data centers.
Resource usage of different projects